
Introduction
As corn producers work on crop budgets to evaluate the profitability of a crop, and possibly adjusting acres they plan to plant to that crop the following year, it is important to evaluate how input costs and the potential price of that crop affect profitability. During a period of increasing fertilizer prices, the first important management step is to take soil tests to measure current soil nutrient levels. This is a valuable tool to help determine the kind and amount of fertilizer to apply to meet the crop needs the following year. If requested, fertilizer recommendations are often available with the soil test results. These recommendations depend on the realistic yield expectations (RYE) the producer establishes for each field to determine the amount of each nutrient needed to meet that RYE. When considering which nutrients a producer might want to adjust due to increasing fertilizer cost, it would be logical to start with the nutrients that have the highest use rate (and potential response) by the corn crop. The three primary macronutrients needed by a corn crop are Nitrogen (N), Phosphorus (P), and Potassium (K).
Nitrogen
Often, the highest use rate nutrient for corn production (per bushel of production) is N. Also, nitrate N is very mobile as it can be moved easily by water through the soil profile. The crop requirement needed to reach expected yields is very dependent on the addition of N fertilizer, year to year. One tool a producer in the central and northern Corn Belt can use to help find the most profitable N rate in an environment of changing N cost and changing crop prices is the Corn Maximum Return to N (MTRN) calculator.1 This tool was developed and is maintained by the Midwest Land Grant Universities can be used to generate MRTN rates for different anhydrous ammonia costs and different corn prices. The website provides a tool to calculate the economic return of a N application using different N and corn prices to find the most profitable N rates based on recent N rate research data. The method used follows a regional approach for determining N application rates that are implemented in seven Midwestern states. The default price setting in the N rate calculator is with prices that result in a ratio of 1:10. At this ratio, the last bushel of yield produced as the N rate increases, pays for 10 pounds of N; if that bushel can only pay for 5 pounds of N, the corn producer loses money.(2)
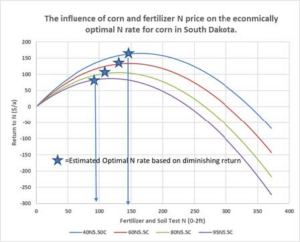
Figure 1. The influence of the prices of corn and fertilizer Nitrogen (N) on the economically optimal N rate for corn in South Dakota.(3) Graph courtesy Of Anthony Bly, Soils Field Specialist, SDSU Extension.
If a corn producer is not in an area where an interactive tool is available, other ways to adjust nitrogen application rates during times of increasing fertilizer prices are available. Any of these processes start with a soil test as previously recommended. South Dakota State University has run economic analyses utilizing different costs per unit of N for different commodity pricing and graphed this relationship to come up with the optimum N rate to help maximize profit (Figure 1).
This graph tracks the relationship of $.40, $.60, $.80, and $.95/lb N prices compared to $5.50 corn per bushel. As the price of N increases, the optimum rate of return per acre on the N applied drops based on diminishing return. Looking at a similar graph using the MRTN calculator for Iowa, the maximum return to N/acre in a corn-on-corn rotation at $.95/lb N is 165 lb/N/acre, where maximum return to N/acre at the $.40/lb N is 199 lb/N/acre.
Note: $1560 per ton NH3 = $.95 /lb N and the price per unit of N is typically less for NH3 fertilizer than any other source of commercial N fertilizer.
Another way to reduce N rates is to reduce your N application rates by 15 to20 lb N/acre from your regular rates.4 This approach would be applicable in a scenario where there is a typical 50% increase in the cost on N per ton, but in a scenario of a 100% increase in the price of N the reduction of 15 to20 lb of N/acre may not be enough. Corn response to applied N is not even across the applied N rates. For example, at lower application rates, more bushels of corn are produced compared to higher application rates, where the incremental yield increase is diminished to a point of no further yield improvement.(3)
One key fact to understand about how to maximize profitability relates to maximum yield. Fertilizer N rates for maximum profit, under all price scenarios, are always lower than the N rates required for maximum yield.
Potassium and Phosphate
Penn State University typically recommends that fields with soil test levels in the optimum range or above for P and K be fertilized around the crop removal rates to maintain soil nutrient levels in the optimum range. Soils testing in the optimum range for a nutrient have enough nutrient supplying capacity to grow crops without any deficiency for at least one, if not several, years. Therefore, when fertilizer prices are very high, it may not be cost effective to pre-replace the nutrients that will be utilized when the soils are in the optimum range.(4) If soil test levels are below the optimum range then the fertilizer recommendation for each soil test, for each field should be followed to help maximize the return per dollar spent for these nutrients. Growers must remember that sound fertilizer management considers timing, placement, and source of materials for each nutrient.
Other non-primary macronutrients and micronutrients
When considering modifying a fertility program for other nutrients, when fertilizer prices are increasing, it is again very important to understand the nutrient availability for each nutrient in the soil for each field, and that will rely on an accurate, recent soil test. Even though the amount of each of these nutrients used by a corn crop on a yearly basis can be very small, an acute deficiency can have a very negative impact on yield potential. Follow the fertility recommendation from the soil testing lab for each field for the realistic expected yield. A common recommendation for every field across the farm (blanket recommendation) for these nutrients will not be as economically cost effective as following the soil test for an individual field and fertilizing accordingly. Fertilizing fields individually places the fertilizer in the fields with the potential for the greatest response to help maximize the return on fertilizer investment.
Best Management Practices
Other management practices along with varying fertilizer rates to maintain profitability during times of increasing fertilizer costs include:
- Utilize variable rate technology (when available) to fertilize to a yield zone requirement not on a whole field recommendation.
- Use best practices for placement, source, and timing to increase fertilizer efficiency.
- Band fertilizer to enhance efficiency (especially on very deficient soils).
- Use manure as a fertilizer source (when available and cost effective).
- Prioritize manure applications on fields that are most deficient in N, P, and K fertility.
- Manure can also be a very good source of micronutrients.
- Inject manure or apply when temperatures are cold to reduce N loss due to volatilization.
- Prioritize liming over fertilizers if soil pH is below optimum level.
- Consider altering rotation to a crop that has lower fertilizer requirements.