
Physiological Maturity and Grain Drydown
Physiological maturity occurs when the amount of sucrose moving from the plant to the kernels is below a certain level. The cells at the connection compress and die, forming a “black” layer that blocks the movement of sucrose to the kernel. Normally this occurs when the plant reaches full maturity or growth stage R6, but loss of leaf tissue from hail, diseases, or frost can cause the black layer to form prior to kernel maturity.
Under normal growing conditions, grain moisture content at black layer is about 30%; however, this can vary depending on the corn product. The rate of drydown is dependent on environmental conditions, corn product attributes, planting date, pest and disease impacts, and fertility deficiencies. The primary loss of kernel moisture is through the pericarp. Typical loss of moisture content per day may range from 0.4 to 0.8% depending on environmental temperature and moisture but can be as low as 0.3% or greater than 1%.1 Maximum drydown rates occur in warm temperatures, low humidity, and windy conditions. As day length becomes shorter and average temperatures decrease, the rate of moisture content loss generally decreases. Consequently, corn maturing at the beginning of September should dry faster than corn that matures in October.
Corn crop conditions that can impact grain drydown include:
- Fewer and thinner husk leaves
- Quick death (natural or by disease) of husk leaves
- Husks that are open at the ear tip • Overall husk looseness
- Ears that droop from an upright position as upright ears capture and hold rainfall
- Thinner kernel pericarps or outer layer
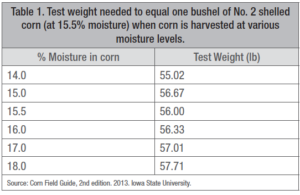
The optimum harvest moisture content for corn is around 23 to 25%.(3) At this moisture content range, kernels generally shell from the cob easily. During harvest time, kernel moisture content loss averages about 1 to 2%/day.1 Waiting to harvest until moisture content is about 17 to 19% can help to reduce artificial drying costs; however, there can be a greater potential for stalk lodging, ear drop, and mechanical loss of kernels during harvest.
Test Weight and Grain Moisture
Test weight (TW) is measured in terms of pounds of grain per volumetric “Winchester” bushel (bu) (a cylinder 18.5 inches in internal diameter and 8 inches deep). The official minimum TW for No. 1 yellow corn is 56 lbs/bu and 54 lbs/bu for No. 2 yellow corn.
The relationship between TW and drydown is an inverse relationship. The higher the grain moisture content, the lower the TW. Test weight increases as kernels dry if the kernels remain in good condition and are not cracked. As kernels dry and become smaller, more kernels can fit into the volume of the container, thus increasing the TW. There is not a relationship between the rate of drydown and lower or higher TW.
Test weight is measured when grain is sold and can affect the price offered in certain areas, such as those that offer premiums for high TW or when selling in the whole food grade market. However, in most cases, only TWs below the minimum for No. 2 yellow corn would be discounted.2 Any stress that prematurely stops or reduces grain fill and/
or interferes with photosynthesis could lower yield potential and TW.
Grain Yield and Test Weight
Grain yield is determined by the number of kernels per acre and the weight of each kernel, which is represented by the following equation:(5)
Corn Yield (bu/acre) = (# of kernels/acre x weight/kernel @ 15.5% moisture content) ÷ 56 lb/bu
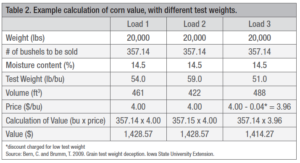
In comparison, TW measures the weight of corn in pounds that can fit into a bushel. Yield is a direct measure of kernel weight and kernel number. Test weight is not related to grain yield. Test weight is only partially related to kernel weight because there is the volume component associated with the measurement. Factors that affect TW, but not corn yield, are those that influence how kernels fit or pack together such as seed coat slipperiness, kernel shape, and size. Due to the volume component, TW influences how many bushels can fit into a bin, wagon, or truck, but not bu/acre. Yield can be high and TW low and vice versa. For example, seed size may be small because of various reasons but the density of individual seeds remains unchanged.3,4 Corn yield is the result of accumulated dry matter in the kernel and the number of kernels produced per acre. Two different corn products can be grown in same thethe same environment and produce the same amount of dry matter (12,320 lb of dry matter/acre or 220 bu/acre), but one may have a higher TW, and the higher TW product has less volume per unit of grain. The genetic background of an individual corn product can have an impact on TW. Products that tend to have a higher vitreous (hard or flinty) endosperm can have a higher density and therefore, a higher TW compared to products with floury (soft or dent) endosperms. However, endosperm content does not necessarily correlate to differences in genetic yield potential.
Article Link – Relationship of Corn Test Weight and Drydown Rates